# Regular output
1 + 1[1] 2Since I use R most often, here are some examples using the default styles with R output. See these pages for more specific examples in other languages:
Include this in your YAML front matter after installing the extension:
---
...
filters:
  - output-styling
...
---
Control the styling with output-styling: appearance. You can use default, minimal, or custom.
---
...
filters:
  - output-styling
output-styling:
  appearance: default
...
---# Regular output
1 + 1[1] 2# Errors
1 + aError: object 'a' not found# Warnings
warning("Be careful!")Warning: Be careful!# Messages
message("Here's a message")Here's a message# Regular output
1 + 1[1] 2# Errors
1 + aError: object 'a' not found# Warnings
warning("Be careful!")Warning: Be careful!# Messages
message("Here's a message")Here's a messageHere’s a less contrived example with actual R code.
library(ggplot2)
library(dplyr)
Here’s a message:
penguins |>
  group_by(island, sex) |>
  summarize(avg_weight = mean(body_mass))
`summarise()` has grouped output by 'island'. You can override using the
`.groups` argument.# A tibble: 9 × 3
# Groups: island [3]
island sex avg_weight
<fct> <fct> <dbl>
1 Biscoe female 4319.
2 Biscoe male 5105.
3 Biscoe <NA> NA
4 Dream female 3446.
5 Dream male 3987.
6 Dream <NA> 2975
7 Torgersen female 3396.
8 Torgersen male 4035.
9 Torgersen <NA> NA Here’s an error:
ggplot(penguins, aes(x = bill_dep, y = body_mass)) +
  goem_point()
Error in goem_point(): could not find function "goem_point"And here’s a warning:
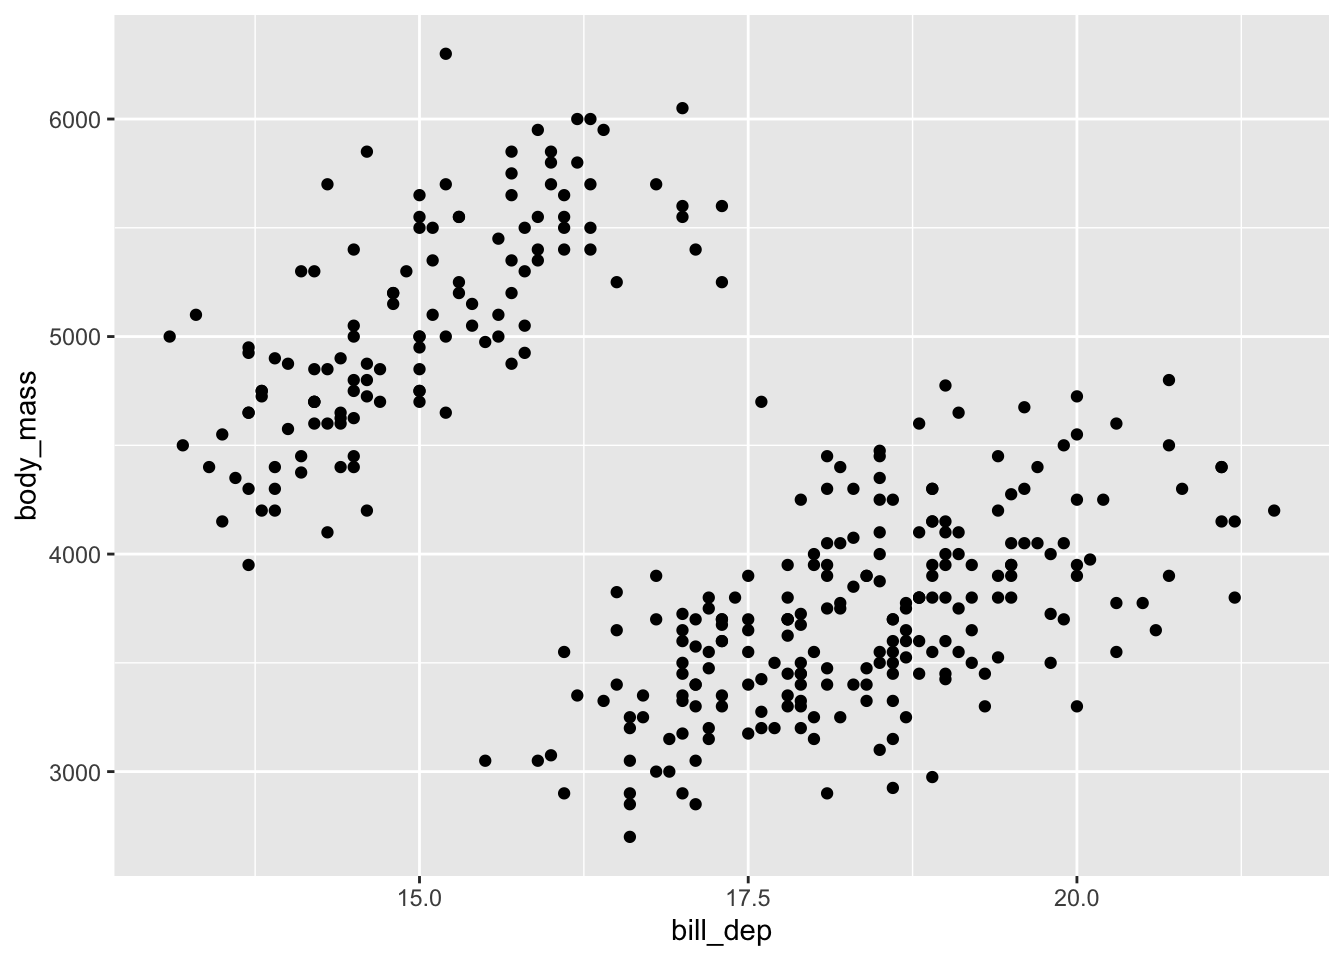
ggplot(penguins, aes(x = bill_dep, y = body_mass)) +
  geom_point()
Warning: Removed 2 rows containing missing values or values outside the scale range
(`geom_point()`).